Introduction to Trading View and Its Core Features
In the fast-paced world of trading and investing, having access to powerful, reliable charting tools is essential for making informed decisions. trading view has established itself as a leading platform that combines sophisticated charting capabilities with social networking features, creating an all-in-one environment for traders and investors worldwide. Whether you’re a seasoned professional or a beginner, understanding the platform’s core features can significantly enhance your market analysis and trading strategies.
Understanding Trading View’s Charting Tools
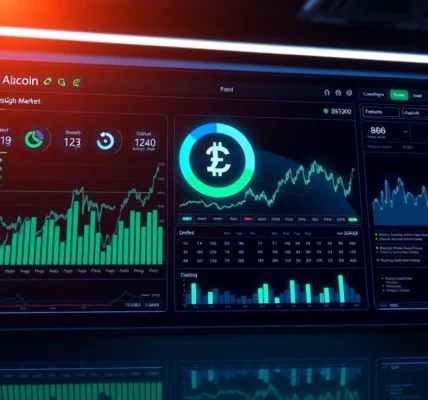
At the heart of Trading View lies its comprehensive suite of charting tools designed to visualize market data effectively. The platform provides highly customizable, real-time interactive charts that support numerous chart types—candlestick, bar, line, area, and more. It enables traders to analyze price movements over different timeframes, from minutes to decades, facilitating both short-term trading and long-term investing.
One of Trading View’s notable strengths is its cloud-based architecture, allowing seamless access from any device—be it desktop, tablet, or smartphone. The intuitive interface includes features such as multiple chart panes for comparing assets side by side, synchronized cursors, and the ability to save and revisit your setups anytime. For example, a trader analyzing Bitcoin’s volatility can overlay multiple indicators and drawings to spot potential entry and exit points with precision.
Key Features for Traders and Investors
Trading View offers a host of features tailored to meet diverse trading needs:
- Social Trading Network: Users can publish ideas, share insights, and follow other traders globally, fostering a community-driven environment.
- Real-Time Data: Access to live market data across stocks, cryptocurrencies, forex, commodities, and indices ensures timely decision-making.
- Custom Indicators and Scripts: The platform supports Pine Script, a proprietary scripting language, allowing traders to create or customize indicators for unique analysis.
- Alert System: Users can set price alerts, indicator triggers, or drawing-based alerts to stay notified of important market movements.
- Multiple Market Coverage: From the S&P 500 to niche cryptocurrencies, Trading View covers a broad spectrum, making it an invaluable all-market resource.
Getting Started with the Platform
Getting started with Trading View is straightforward. Sign up for a free account, which unlocks essential features, or opt for a premium plan for advanced tools and expanded access. Setting up your workspace involves customizing watchlists, choosing preferred chart types, and adding indicators relevant to your trading style. The platform also offers tutorials, webinars, and community forums to help new users maximize their efficiency and effectiveness.
How to Use Trading View for Effective Market Analysis
Technical Analysis Techniques in Trading View
Technical analysis (TA) is fundamental to many trading strategies, and Trading View provides an extensive arsenal of TA tools. Common techniques include trend line analysis, support and resistance levels, and pattern recognition (head and shoulders, double tops/bottoms). By combining these with volume analysis and oscillators like RSI or MACD, traders can spot potential reversals or continuations with greater confidence.
For instance, a trader monitoring the EUR/USD currency pair might identify a double bottom pattern at a key support zone, confirming a potential bullish reversal. Integrating Fibonacci retracement levels can further refine entry points, making Trading View an indispensable platform for precise technical analysis.
Utilizing Indicators and Drawing Tools
Indicators are vital for confirming trends and signals. Trading View supports hundreds of built-in indicators, and the Pine Script allows creating custom ones. Popular choices include Moving Averages, Bollinger Bands, and the Ichimoku Cloud, each providing different perspectives on price action.
Drawing tools such as trendlines, channels, and Fibonacci levels help visualize market structure. For example, drawing an ascending channel in a stock’s chart can help determine breakout points or trend strength. The platform’s ability to combine various tools seamlessly boosts analytical precision.
Designing Custom Watchlists and Alerts
Organizing assets into custom watchlists ensures quick access to your preferred markets. Setting alerts on specific levels or indicator conditions enables you to stay proactive without constant monitoring. For example, a trader might set an alert to notify when Bitcoin surpasses a specific resistance, prompting immediate analysis or action.
Advanced Strategies Using Trading View
Integrating Trading View with Other Trading Platforms
Trading View’s open API and compatibility with brokerage platforms like Binance, Interactive Brokers, and others allow for integrated trading workflows. This integration streamlines order execution directly from charts, reducing latency and improving efficiency.
Automating Trading Signals and Backtesting
One of Trading View’s most powerful features is backtesting with Pine Script, enabling traders to test strategies against historical data. Automating signals based on their script-defined criteria allows for disciplined trading. For instance, a trend-following strategy can be rigorously tested for profitability before live deployment.
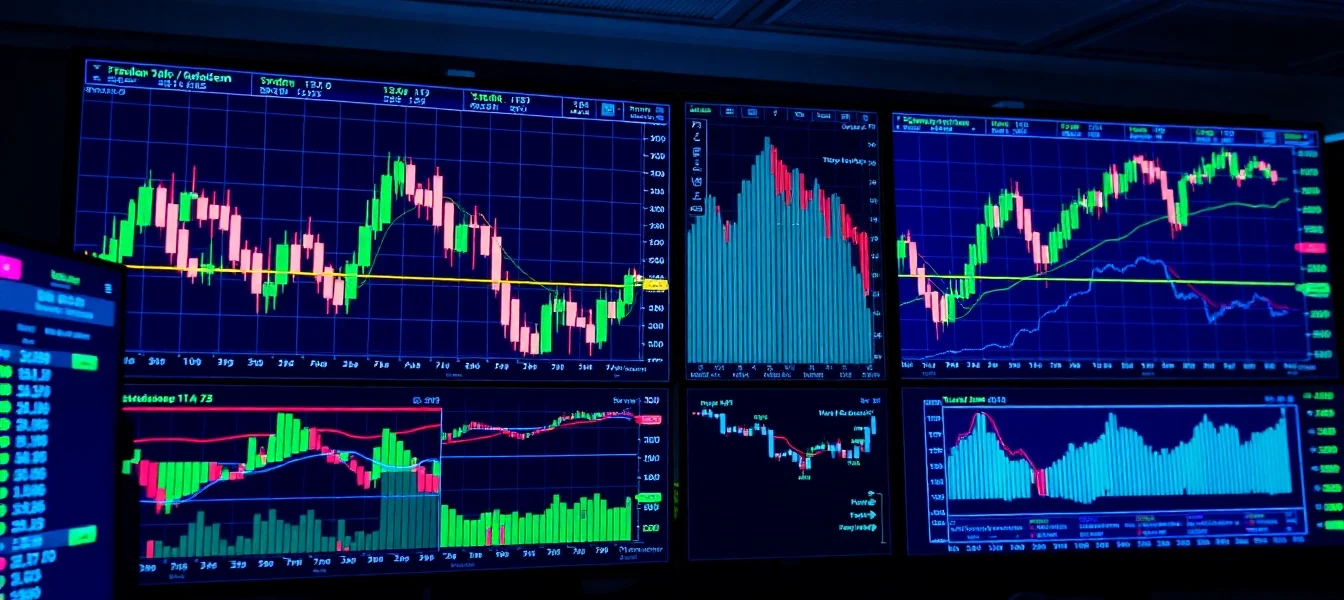
Analyzing Multiple Markets Simultaneously
The multi-chart layout facilitates simultaneous analysis of correlated assets or different markets, helping traders identify broader trends and divergences. For example, analyzing equities, commodities, and forex together can reveal intermarket dynamics influencing your trades.
Best Practices for Maximizing Trading View’s Potential
Maintaining Consistent Trading Routines
Establishing a structured routine—such as daily market scans, chart reviews, and strategy updates—ensures ongoing performance improvement. Trading View’s saved templates and layouts support quick setup and consistency.
Sharing and Collaborating on Ideas
The social aspect of Trading View encourages collaboration. Sharing chart ideas, strategies, and annotations with the community or trusted peers offers diverse insights and feedback, enriching your trading perspective.
Staying Updated with Market News and Insights
Real-time news feeds and economic calendars can be integrated into the platform to stay informed of fundamental catalysts. Combining technical and fundamental analysis provides a comprehensive view, enabling more strategic decisions.
Measuring Success and Improving Strategies
Tracking Your Performance with Trading View
Performance metrics such as win rate, profit factor, and drawdowns can be tracked by logging trades and analyzing chart ideas. The ability to review past predictions and strategies helps identify strengths and areas for improvement.
Adapting to Market Trends and Changes
Market conditions evolve continuously. Regularly updating your analysis techniques and adjusting your trading plan—while leveraging Trading View’s historical data and pattern recognition tools—ensures adaptability.
Continuous Learning and Resource Utilization
Utilize webinars, community ideas, and educational content available on Trading View to stay ahead. Learning from others’ insights and practicing with simulated trades builds confidence and skill over time.